Introduction
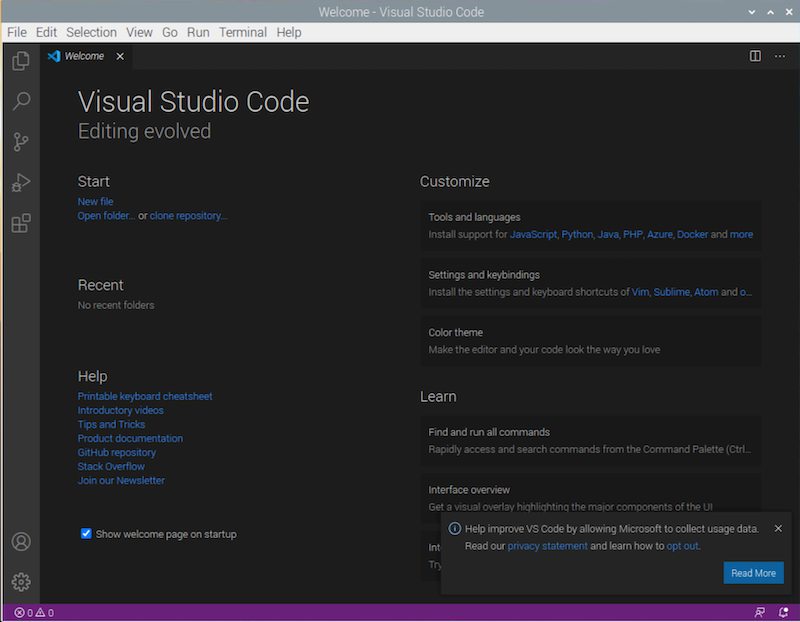
Microsoft has released a version of Visual Studio Code (VSCode) for ARM-based computers like the Raspberry Pi. VSCode is one of the most popular and powerful code editors. There are many useful extensions for VSCode that make programming a lot easier.
For example, we can start a Jupyter notebook inside VSCode. Jupyter is an interactive Python environment that we can use to experiment with machine learning libraries. In this tutorial, we will:
- install and use VSCode on Raspberry Pi,
- install and use Jupyter on Raspberry Pi,
- do a simple machine learning lab inside Jupyter.
Install Visual Studio Code
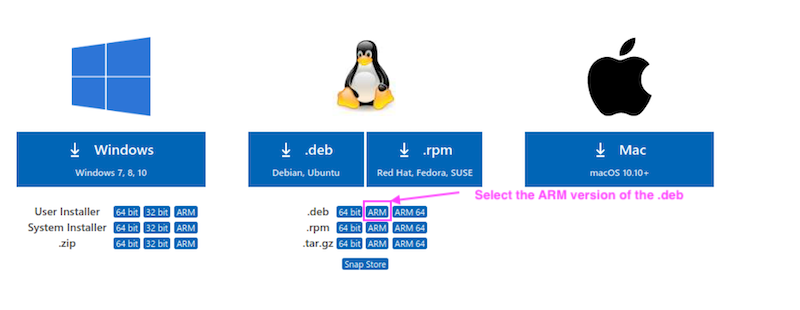
First, visit the website of Visual Studio Code. On this page, click the link for the ARM version of the deb file.
When the download is completed, open the terminal and navigate to the Downloads folder.
pi@raspberrypi:~ $ cd ~/Downloads
Check the name of the installation file.
pi@raspberrypi:~ $ ls
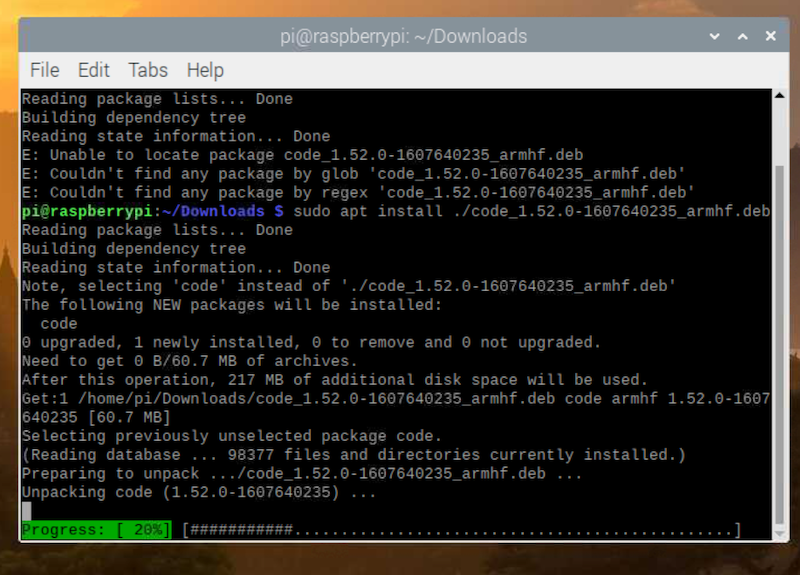
Suppose the name of the file is code_1.52.0-1607640235_armhf.deb, type the following command to install Visual Studio Code.
pi@raspberrypi:~ $ sudo apt install ./code_1.52.0-1607640235_armhf.deb
Replace code_1.52.0-1607640235_armhf.deb by the name of the file that you have downloaded. Do not miss the ./ before the filename. The installation should be completed in a few minutes.
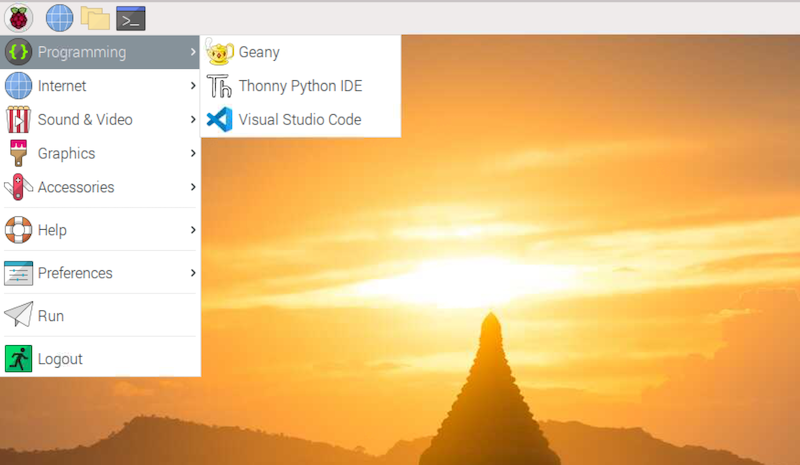
After the installation is completed, we can launch VSCode from the ‘Programming’ menu.
We can also launch VSCode from the terminal.
pi@raspberrypi:~ $ code
Install the Python extension
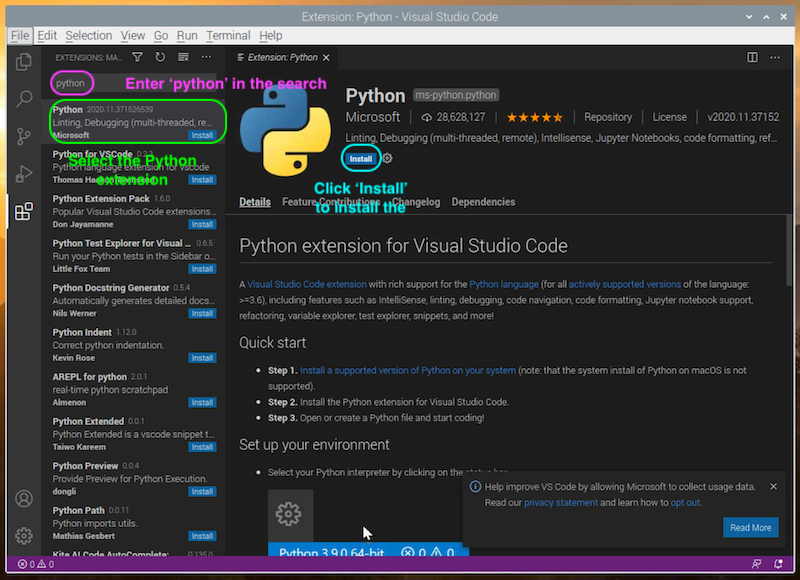
To install an extension, we can click the extension icon on the left.
In the search field, enter ‘python’, then select the Python extension made by Microsoft. Click the ‘Install’ button to install this extension.
Install Jupyter
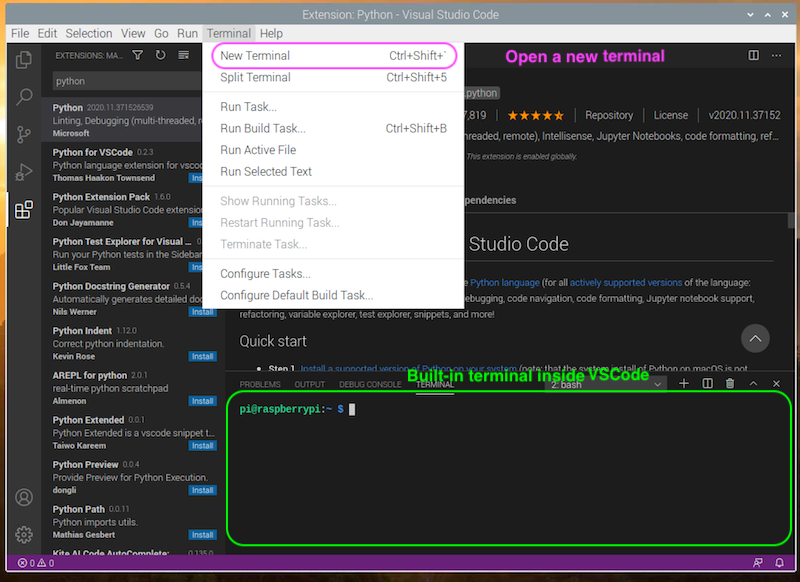
Next, we will install Jypyter on Raspberry Pi. We can use the terminal as before, but we can also use the built-in terminal inside VSCode. To open the terminal, click Terminal → New Terminal in the menu or press ‘Ctrl + Shift + `’.
In the terminal, use the following command to install Jupyter:
pi@raspberrypi:~ $ pip3 install jupyterlab
When the installation is completed, we can create a new Jupyter notebook directly inside VSCode. To do that, click View → Command Palette… or press ‘Ctrl + Shift + P’. Type ‘Jupyter’ in the search field of the command palette and select ‘Create New Blank Jupyter Notebook’.
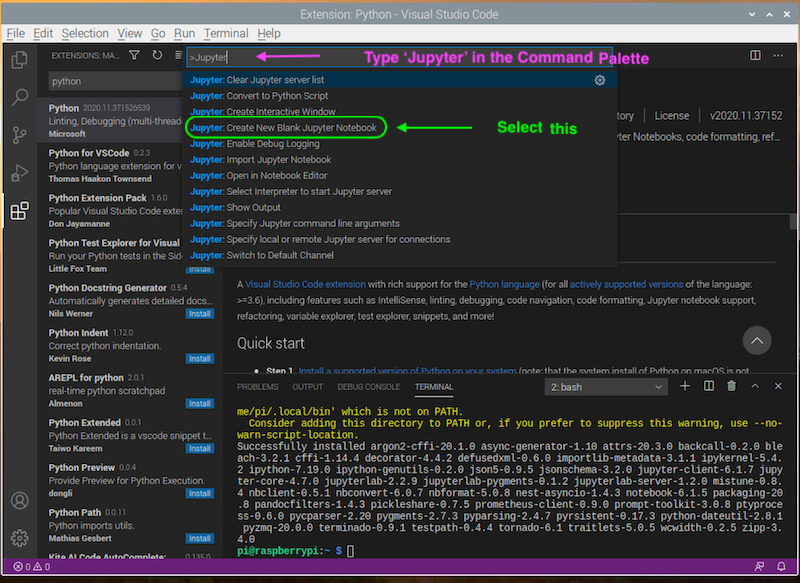
Note: Many functionalities provided by VSCode extensions can be used through the Command Palette.
In the Jupyter notebook, we can write Python code inside a cell, and the code will be executed if we press ‘Shift + Enter’. The result of the code will then be shown in the cell.
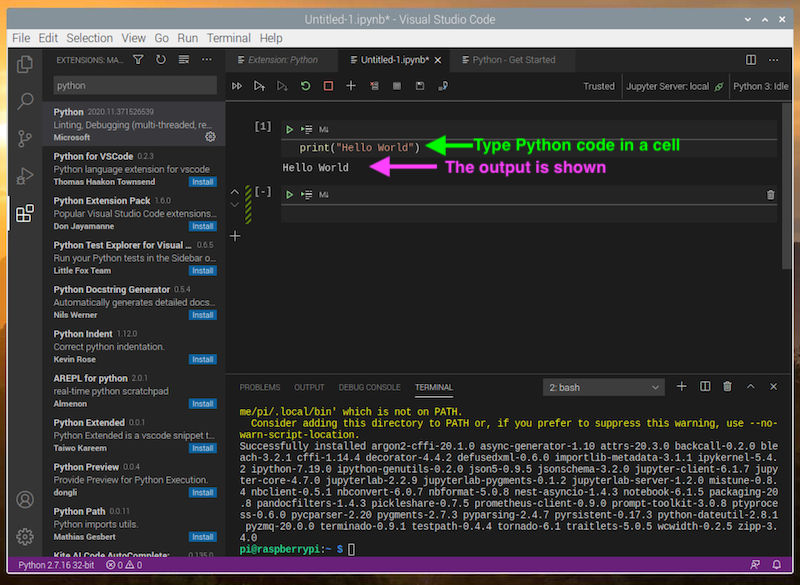
Since we can run the cell one by one at any order we want, Jupyter is an excellenet tool for us to experiment with different things in Python. After writing codes to the notebook, don’t forget to save it (as a ‘.ipynb’ file) and share it with others!
Do a Machine Learning Experiment
Download this notebook from the repository and open it in VSCode. In this notebook, we perform a simple linear regression with scikit-learn, a popular Python package for machine learning. Linear regression can be thought as drawing the best-fit line that matches the given data as closely as possible. If you want to know more about the mathematics behind linear regression and other methods of statistical learning, you may read An Introduction to Statistical Learning with Applications in R.
We go through the steps here and you can try it on your own.
Note: If you receive a warning when opening the notebook, simply click ‘Trust’ to dismiss the warning.
First, we install or update the libraries that we are going to use.
!sudo apt-get install libatlas-base-dev -y
!pip3 install -U sklearn numpy matplotlib
Note:
apt-getandpip3are Linux commands, and Linux commands can be executed inside the notebook. To execute a Linux command, add an exclamation mark before the command.
Then, we import the necessary libraries.
import numpy as np
import sklearn
import matplotlib as mpl
import matplotlib.pyplot as plt
from sklearn.linear_model import LinearRegression
After that, we setup matplotlib for plotting graphs.
%matplotlib inline
mpl.rc('axes', labelsize=14)
mpl.rc('xtick', labelsize=12)
mpl.rc('ytick', labelsize=12)
Notice that %matplotlib inline is a Jupyter command. It allows us to plot graphs with matplotlib right inside the Jupyter notebook.
Next, we generate some data.
X = np.random.rand(100, 1)
y =  3 * X + 4 + np.random.randn(100, 1)
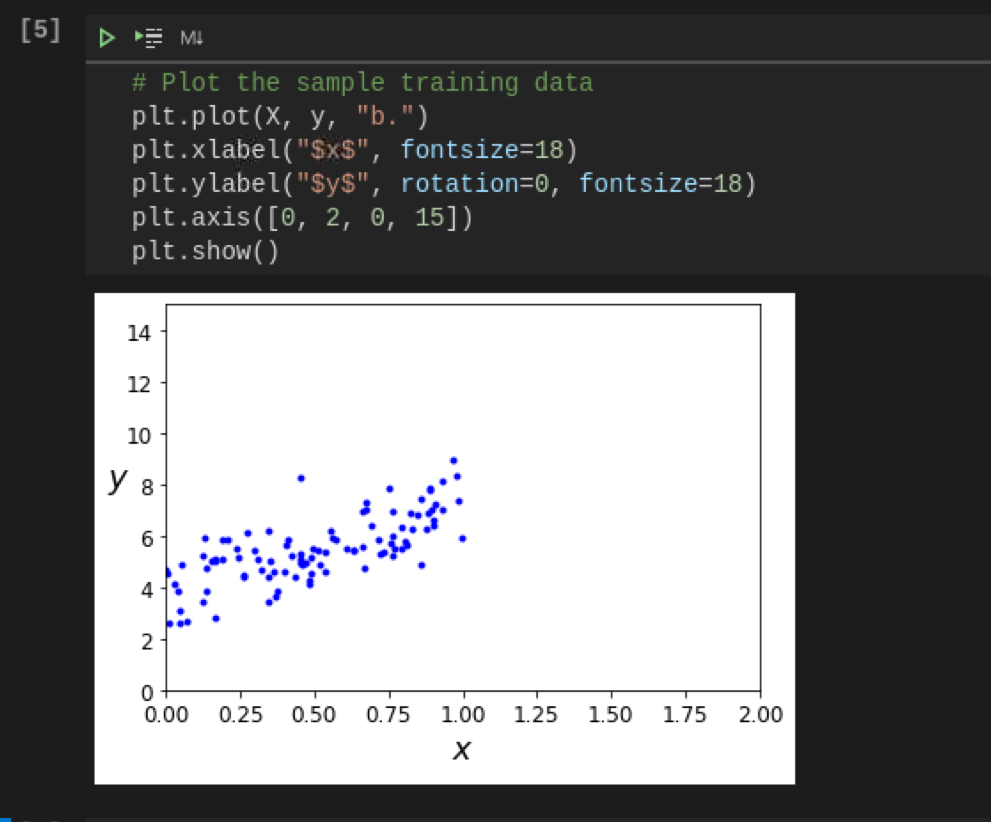
X is an array containing some random numbers from 0 to 1. Each number in y is created by multiplying the corresponding number in X by 3, and then adding 4 and a random number to the product. Therefore, the best-fit line should look like ‘y = 3x + 4’. Let’s plot the data and see if this is the case.
plt.plot(X, y, "b.")
plt.xlabel("$x$", fontsize=18)
plt.ylabel("$y$", rotation=0, fontsize=18)
plt.axis([0, 2, 0, 15])
plt.show()
Let’s do the linear regression now. Scikit-learn makes this task extremely simple. We only need to create a LinearRegression model object, and fit the model with the training data. We can look at the intercept and the slope of the straight line after the fitting.
lin_reg = LinearRegression()
lin_reg.fit(X, y)
lin_reg.intercept_, lin_reg.coef_
We can use the model to make predictions on new data.
X_test = np.random.rand(100, 1)
y_test = lin_reg.predict(X_test)
X_test[0], y_test[0] # Look at the first result
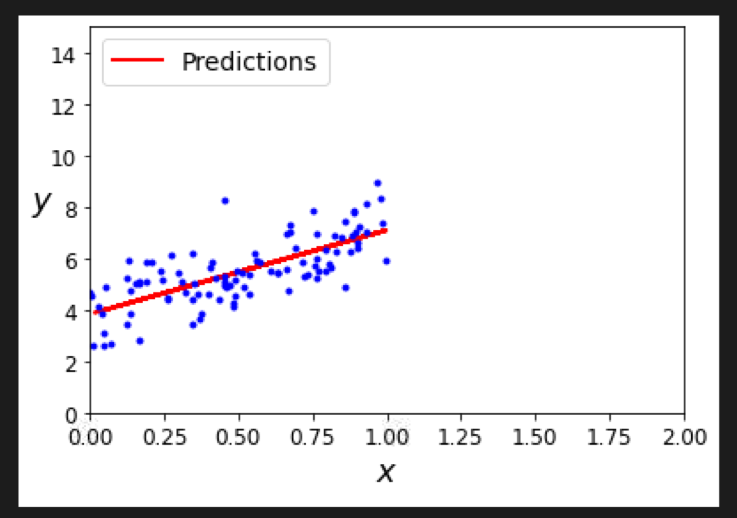
Finally, we can plot the results and compare the models and the training data.
plt.plot(X_test, y_test, "r-", linewidth=2, label="Predictions")
plt.plot(X, y, "b.")
plt.xlabel("$x$", fontsize=18)
plt.ylabel("$y$", rotation=0, fontsize=18)
plt.legend(loc="upper left", fontsize=14)
plt.axis([0, 2, 0, 15])
plt.show()
Conclusion
Although the Raspberry Pi is not a powerful computer that can train giant machine learning models, it is definitely enough for exploring many machine learning methods that are not computationally intensive. Using VSCode with the Python extension and the Jupyter notebook makes the Raspberry Pi an excellent platform for studying these machine learning strategies. We will explore machine learning further with these tools in future tutorials.