Introduction
The Internet is full of real time data. Weather information, stock quotes, etc, can be obtained from different service providers. Since most of the Raspberry Pi computers come with Wifi, and it’s extremely easy to handle the data obtained from the Internet with Python, it makes sense to use Raspberry Pi to fetch data from the Internet automatically.
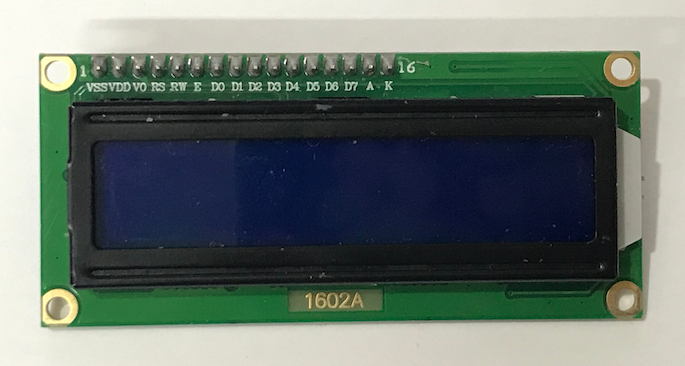
On the other hand, every Raspberry Pi comes with GPIOs, which can be used to connect different devices. For example, we can connect a 16 x 2 character LCD display to the Raspberry Pi.
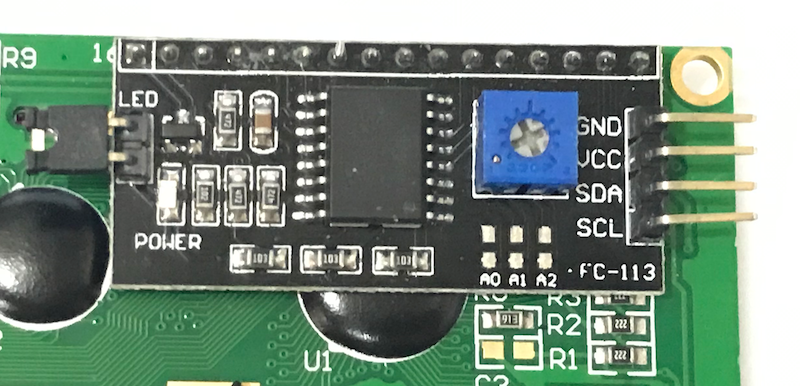
A communication interface called I2C is frequently used by many devices. Any I2C device uses 4 pins: one for power, one for the ground, one for data (“SDA”) and one for clock signals (“SCL”). For instance, this character LCD display can be connected to Raspberry Pi or other microcontroller via I2C.
This all sounds complicated. Fortunately, Adafruit has created the CircuitPython library for the Raspberry Pi. With this library, we can use I2C devices on Raspberry Pi very easily.
In this tutorial, you will learn:
- how to get and parse information from the Internet with Python,
- use CircuitPython to control I2C devices.
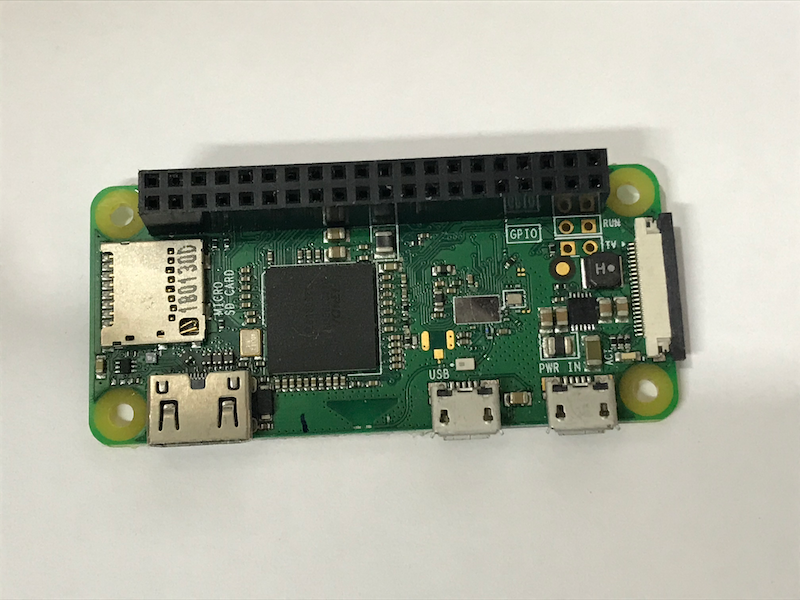
To achieve the above learning outcomes, we will use a Raspberry Pi Zero W to fetch some weather data from the Internet, and display the fetched data on a character LCD screen:
Materials and Tools
- Raspberry Pi with Internet connection x 1
- LCD1602 display with I2C x 1
- Jumper wires
JSON data
We usually use a browser to look for information on the Internet. We type a URL in the browser, and the browser will display an HTML page. However, if you look at the source of a HTML page, you will see that HTML is actually kind of messy.
For a program, it usually needs a fraction of the information inside the HTML source file only. For instance, it does not require the fancy CSS styling or Javascript animation effects. Luckily, there is a simpler, stripped down way to represent data. JSON is a clean way to represent data, and it’s the primary data format used by different data services.
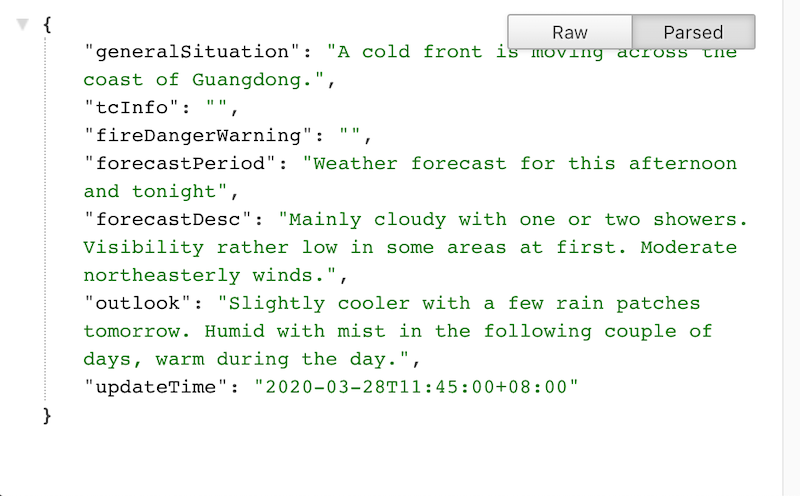
For example, the Hong Kong Observatory provides a set of Open Data API so it’s actually really easy to get the latest weather update from the Observatory. To get the latest local weather forcast, all you need to do is to enter this URL in the browser:
https://data.weather.gov.hk/weatherAPI/opendata/weather.php?dataType=flw&lang=en
Instead of showing a webpage, the data is displayed in the JSON format in a not-so-fancy way.
NOTE: You may see the term ‘RESTful APIs’ from time to time. Many of these data services are indeed RESTful APIs, which means you can interact with these services with standard HTTP methods (GET, POST, etc.). Since we only need to get this time, we won’t go into the details of RESTful APIs.
In fact, the format is so clean that we can parse the information with a single method in Python, which we will use in the next section.
Enable I2C
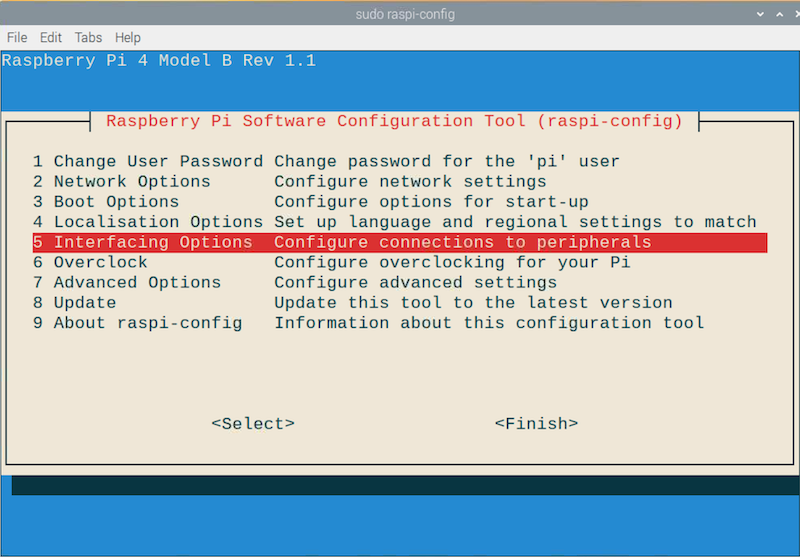
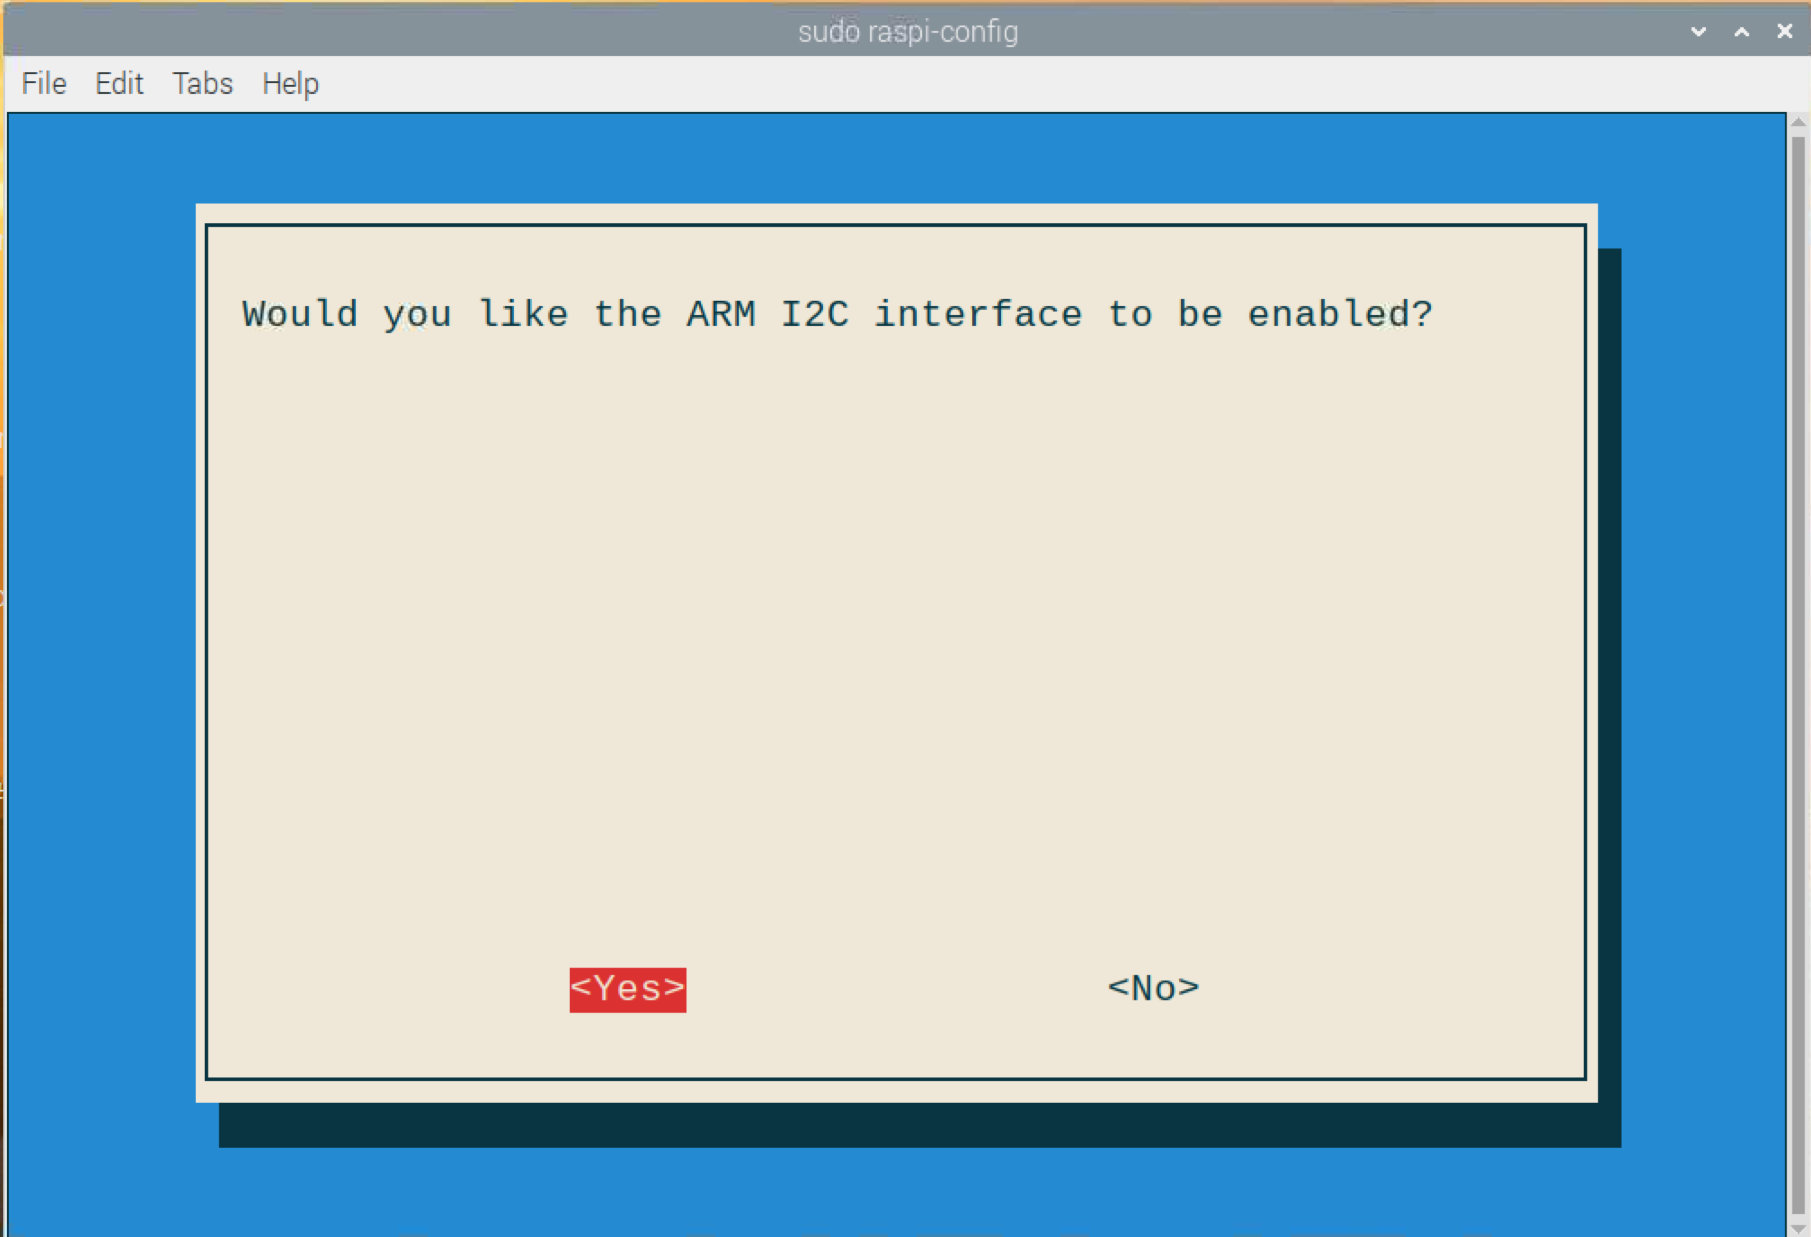
First, we need to use sudo raspi-config to enable I2C of the Raspberry Pi.
pi@raspberrypi:~$ sudo raspi-config
Then, move down to ‘Interface Options’ and press ENTER.
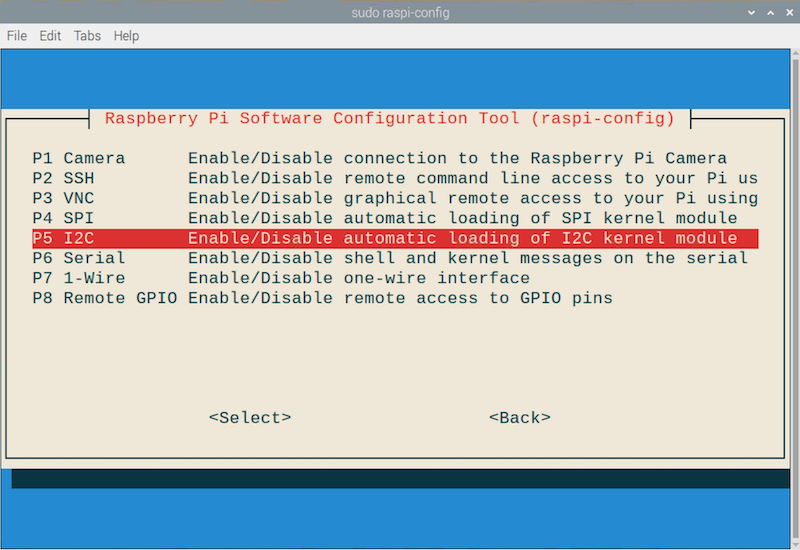
Then, move down to ‘I2C’ and press ENTER.
Then, select ‘Yes’.
After going back to the main menu, select ‘Finish’ to close the raspi-config program. You need to reboot your Raspberry Pi.
Install libraries
Next, we are going to install two Python libraries: Adafruit’s CircuitPython and the library for the LCD1602 display. Let’s create a new folder on the Raspberry Pi for this project inside the terminal.
pi@raspberrypi:~$ mkdir rpi-weather && cd rpi-weather
Then, make sure that the Raspberry Pi Zero W is on the Internet. We will download the libraries from the Internet and install them. If everything is ready, use pip3 to install RPI.GPIO and adafruit-blinka:
pi@raspberrypi:~/rpi-weather$ pip3 install --upgrade RPI.GPIO adafruit-blinka
Finally, we download the LCD1602 library from Github.
pi@raspberrypi:~/rpi-weather$ git clone https://github.com/dhylands/python_lcd.git
pi@raspberrypi:~/rpi-weather$ cp python_lcd/lcd/lcd_api.py .
pi@raspberrypi:~/rpi-weather$ cp python_lcd/lcd/circuitpython_i2c_lcd.py .
NOTE: We only need
cd_api.pyandcircuitpython_i2c_lcd.pyonly, so it’s better to just copy the python scripts and not to install the entire library.
Use Python to get and parse JSON data
Let’s launch an code editor like Thonny in the Raspberry Pi. Copy the following code and save it to the rpi-weather directory as pi-weather.py.
from requests import get
url = 'https://data.weather.gov.hk/weatherAPI/opendata/weather.php?dataType=rhrread&lang=en'
data = get(url).json()
print(data)
In the terminal, type python3 rpi-weather.py to run the script. You should be able to see the output as in the browser!
pi@raspberrypi:~/rpi-weather $ python3 rpi-weather.py
{'rainfall': {'data': [{'unit': 'mm', 'place': 'Central Western District', 'max': 1, 'min': 0, 'main': 'FALSE'}, {'unit': 'mm', 'place': 'Eastern District', 'max': 3, 'min': 0, 'main': 'FALSE'}, {'unit': 'mm', 'place': 'Kwai Tsing', 'max': 3, 'min': 1, 'main': 'FALSE'}, {'unit': 'mm', 'place': 'Islands District', 'max': 0, 'main': 'FALSE'}, {'unit': 'mm', 'place': 'North District', 'max': 1, 'min': 0, 'main': 'FALSE'}, {'unit': 'mm', 'place': 'Sai Kung', 'max': 1, 'min': 0, 'main': 'FALSE'}, {'unit': 'mm', 'place': 'Sha Tin', 'max': 3, 'min': 1, 'main': 'FALSE'}, {'unit': 'mm', 'place': 'Southern District', 'max': 2, 'min': 0, 'main': 'FALSE'}, {'unit': 'mm', 'place': 'Tai Po', 'max': 2, 'min': 0, 'main': 'FALSE'}, {'unit': 'mm', 'place': 'Tsuen Wan', 'max': 5, 'min': 0, 'main': 'FALSE'}, {'unit': 'mm', 'place': 'Tuen Mun', 'max': 1, 'min': 0, 'main': 'FALSE'}, {'unit': 'mm', 'place': 'Wan Chai', 'max': 1, 'min': 0, 'main': 'FALSE'}, {'unit': 'mm', 'place': 'Yuen Long', 'max': 3, 'min': 0, 'main': 'FALSE'}, {'unit': 'mm', 'place': 'Yau Tsim Mong', 'max': 0, 'main': 'FALSE'}, {'unit': 'mm', 'place': 'Sham Shui Po', 'max': 0, 'main': 'FALSE'}, {'unit': 'mm', 'place': 'Kowloon City', 'max': 0, 'main': 'FALSE'}, {'unit': 'mm', 'place': 'Wong Tai Sin', 'max': 5, 'min': 0, 'main': 'FALSE'}, {'unit': 'mm', 'place': 'Kwun Tong', 'max': 2, 'min': 0, 'main': 'FALSE'}],
'startTime': '2020-03-28T12:45:00+08:00', 'endTime': '2020-03-28T13:45:00+08:00'}, 'icon': [62], 'iconUpdateTime': '2020-03-28T13:05:00+08:00', 'uvindex': {'data': [{'place': "King's Park", 'value': 0.4, 'desc': 'low'}], 'recordDesc': 'During the past hour'}, 'updateTime': '2020-03-28T14:02:00+08:00',
'temperature': {'data': [{'place': "King's Park", 'value': 22, 'unit': 'C'}, {'place': 'Hong Kong Observatory', 'value': 22, 'unit': 'C'}, {'place': 'Wong Chuk Hang', 'value': 23, 'unit': 'C'}, {'place': 'Ta Kwu Ling', 'value': 24, 'unit': 'C'}, {'place': 'Lau Fau Shan', 'value': 22, 'unit': 'C'}, {'place': 'Tai Po', 'value': 23, 'unit': 'C'}, {'place': 'Sha Tin', 'value': 23, 'unit': 'C'}, {'place': 'Tuen Mun', 'value': 21, 'unit': 'C'}, {'place': 'Tseung Kwan O', 'value': 22, 'unit': 'C'}, {'place': 'Sai Kung', 'value': 23, 'unit': 'C'}, {'place': 'Cheung Chau', 'value': 23, 'unit': 'C'}, {'place': 'Chek Lap Kok', 'value': 21, 'unit': 'C'}, {'place': 'Tsing Yi', 'value': 23, 'unit': 'C'}, {'place': 'Shek Kong', 'value': 23, 'unit': 'C'}, {'place': 'Tsuen Wan Ho Koon', 'value': 22, 'unit': 'C'}, {'place': 'Tsuen Wan Shing Mun Valley', 'value': 23, 'unit': 'C'}, {'place': 'Hong Kong Park', 'value': 23, 'unit': 'C'}, {'place': 'Shau Kei Wan', 'value': 22, 'unit': 'C'}, {'place': 'Kowloon City', 'value': 22, 'unit': 'C'}, {'place': 'Happy Valley', 'value': 23, 'unit': 'C'}, {'place': 'Wong Tai Sin', 'value': 23, 'unit': 'C'}, {'place': 'Stanley', 'value': 22, 'unit': 'C'}, {'place': 'Kwun Tong', 'value': 23, 'unit': 'C'}, {'place': 'Sham Shui Po', 'value': 22, 'unit': 'C'}, {'place': 'Kai Tak Runway Park', 'value': 22, 'unit': 'C'}, {'place': 'Yuen Long Park', 'value': 24, 'unit': 'C'}, {'place': 'Tai Mei Tuk', 'value': 23, 'unit': 'C'}], 'recordTime': '2020-03-28T14:00:00+08:00'}, 'warningMessage': '', 'mintempFrom00To09': '', 'rainfallFrom00To12': '', 'rainfallLastMonth': '', 'rainfallJanuaryToLastMonth': '', 'tcmessage': '', 'humidity': {'recordTime': '2020-03-28T14:00:00+08:00', 'data': [{'unit': 'percent', 'value': 92, 'place': 'Hong Kong Observatory'}]}}
Let’s take a look of the code in details.
The first line import the get method from the requests library.
from requests import get
The requests library enables us to send HTTP requests to a web server. The most frequently used HTTP method is GET. Everytime you enter an URL in a browser, you send an HTTP GET request to a web server, and the server respond to the request by sending the HTML data back to the browser. The get method in the requests library does the same thing, only this time Python does the work for you.
Then, we define a string url, which is the URL of the open data API of the Observatory.
url = 'https://data.weather.gov.hk/weatherAPI/opendata/weather.php?dataType=rhrread&lang=en'
The third line is a bit more complicated:
data = get(url).json()
The get method is called with the argument url. By calling the get method, the program will wait for the HTTP response from the server. The response contains lots of information, but we use the JSON data only. Therefore, we call the json method to extract the JSON data.
Display the data on the character LCD
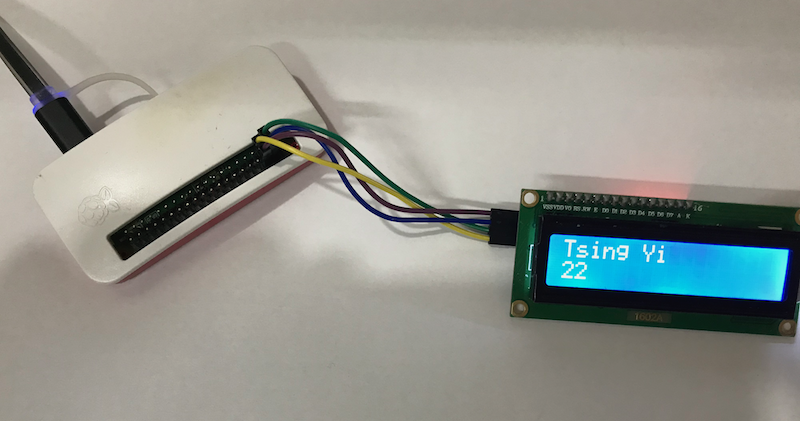
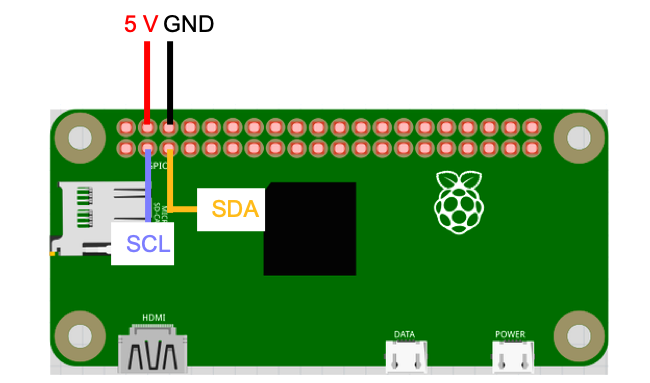
First, connect the character LCD display to the Raspberry Pi.
| LCD1602 | Raspberry Pi |
|---|---|
| VCC | 5V (Pin 4) |
| GND | GND (Pin 6) |
| SDA | SDA (Pin 3, a.k.a. GPIO2) |
| SCL | SCL (Pin 5, a.k.a. GPIO3) |
We need to adjust the codes. Let’s import a few more libraries. Just below from requests import get, add the following two lines:
import board
import busio
from circuitpython_i2c_lcd import I2cLcd
from time import sleep
Both board and busio are from the CircuitPython library. As you will see in a minute, you don’t need to worry about typing the wrong pin numbers when you initialize an I2C device if you use the CircuitPython library. Also, we import the I2cLcd class and the sleep function.
Then, we initialize the LCD display. Add the following lines just below the import statements.
i2c = busio.I2C(board.SCL, board.SDA)
while i2c.try_lock():
    pass
DEFAULT_I2C_ADDR = 0x27
lcd = I2cLcd(i2c, DEFAULT_I2C_ADDR, 2, 16)
In the first line, we create an I2C object by calling the class’s constructor with the SCL and the SDA pins as the arguments.
i2c = busio.I2C(board.SCL, board.SDA)
This is where the CircuitPython really shines: the exact same code can be used in other microcontrollers running CircuitPython! So if you get yourself a Circuit Playground Bluefruit, you can use the character LCD display with the exact same code.
Then, the while loop checks if the program has exclusive access to I2C, and the program continues to run only when it is the case.
while i2c.try_lock():
    pass
You may check out this Adafruit guide to understand more about it.
Afterward, we initialize the LCD display by creating an I2cLcd object:
DEFAULT_I2C_ADDR = 0x27
lcd = I2cLcd(i2c, DEFAULT_I2C_ADDR, 2, 16)
lcd.backlight_on()
DEFAULT_I2C_ADDR = 0x27 defines the address of character LCD display. Every I2C device has an address. This address is important because multiple I2C devices can be connected to the Raspberry Pi, and the Raspberry Pi needs that address to communicate with the device correctly. Finally, we create an instance of I2cLcd with the i2c object, the I2C address, the number of rows and the number of columns as the parameters for the constructor. The backlight is turned on by calling the backlight_on method.
NOTE: This particular LCD1602 display’s address is
0x27, but yours may have a different one. You may need to callbusio.I2C.scan()to check the actual address, as described in this Adafruit guide.
Next, rather than printing out all the JSON data in the console, we extract the information that we want and display it on the LCD display. For example, we can just display the temperatures in different regions. Replace print(data) with the following lines of code:
temp_data = data['temperature']['data']
for entry in temp_data:
    lcd.clear()
    lcd.move_to(0, 0)
    lcd.putstr(entry['place'][:15])
    lcd.move_to(1, 0)
    lcd.putstr(entry['value'])
Recall that the json method has been called:
data = get(url).json()
This method actually parses the JSON string from the HTTP response, and returns the corresponding Python object. Thus, we can use the data inside the object as usual:
temp_data = data['temperature']['data']
The JSON string received from the Observatory’s server represents a dictionary, we can extract the ‘temperature’ entry (a dictionary) by data['temperature']. Similarly, we can obtain the ‘data’ entry (an array) of data['temperature'] by data['temperature']['data']. We assign the array data['temperature']['data'] to the temp_data variable.
Then, we use a for loop to display each of the data inside the temp_data array:
for entry in temp_data:
    lcd.clear()
    lcd.move_to(0, 0)
    lcd.putstr(entry['place'][:15])
    lcd.move_to(0, 1)
    lcd.putstr(str(entry['value']))
    sleep(2)
For each entry in the temp_data array, we first clear the display by calling clear(). Then, we move the cursor to (0, 0), i.e. the first position in the first row, and display the first 16 characters of the ‘place’ entry (a string) in the first row. Similarly, we move the cursor to (0, 1), i.e. the first position in the second row, and display the ‘value’ entry (a number). Finally, we pause the program for 2 seconds before showing the next entry.
NOTE: We need to cast the ‘value’ entry (a number) to a string first before displaying it on the LCD.
NOTE: To get the first 16 characters of the ‘place’ string, we use the substring functionality of Python. You can understand more about this by reading this introduction from w3schools.
Lastly, we wrap the data-fetching and the data-display codes in an infinite while so that the program can run continuously.
while True:
    data = get(url).json()
    # ... The rest of the codes
You should be able to see the data on the screen!
That’s quite a lot of things. If you find any difficulties, be patient. Debugging is just a part of the this learning process. You may have a look of the sample code as a reference. You can also ask us questions on our Facebook page.
Conclusion
This is a very small Raspberry Pi project, but you have done two very important things:
- Getting data from the Internet via a RESTful API
- Using the data from a RESTful API to do something else
You can get other data like real time stock quotes in the same way, and create things that are more exciting, such as stock market analysis with AI. Also, you can use other methods in the requests library to interact with other RESTful APIs. For instance, you can POST the data from a sensor attached to a Raspberry Pi to a Google Sheets spreadsheet via Google’s APIs. The possibility of this paradigm is only limited by our imagination.